
Colors of the Internet
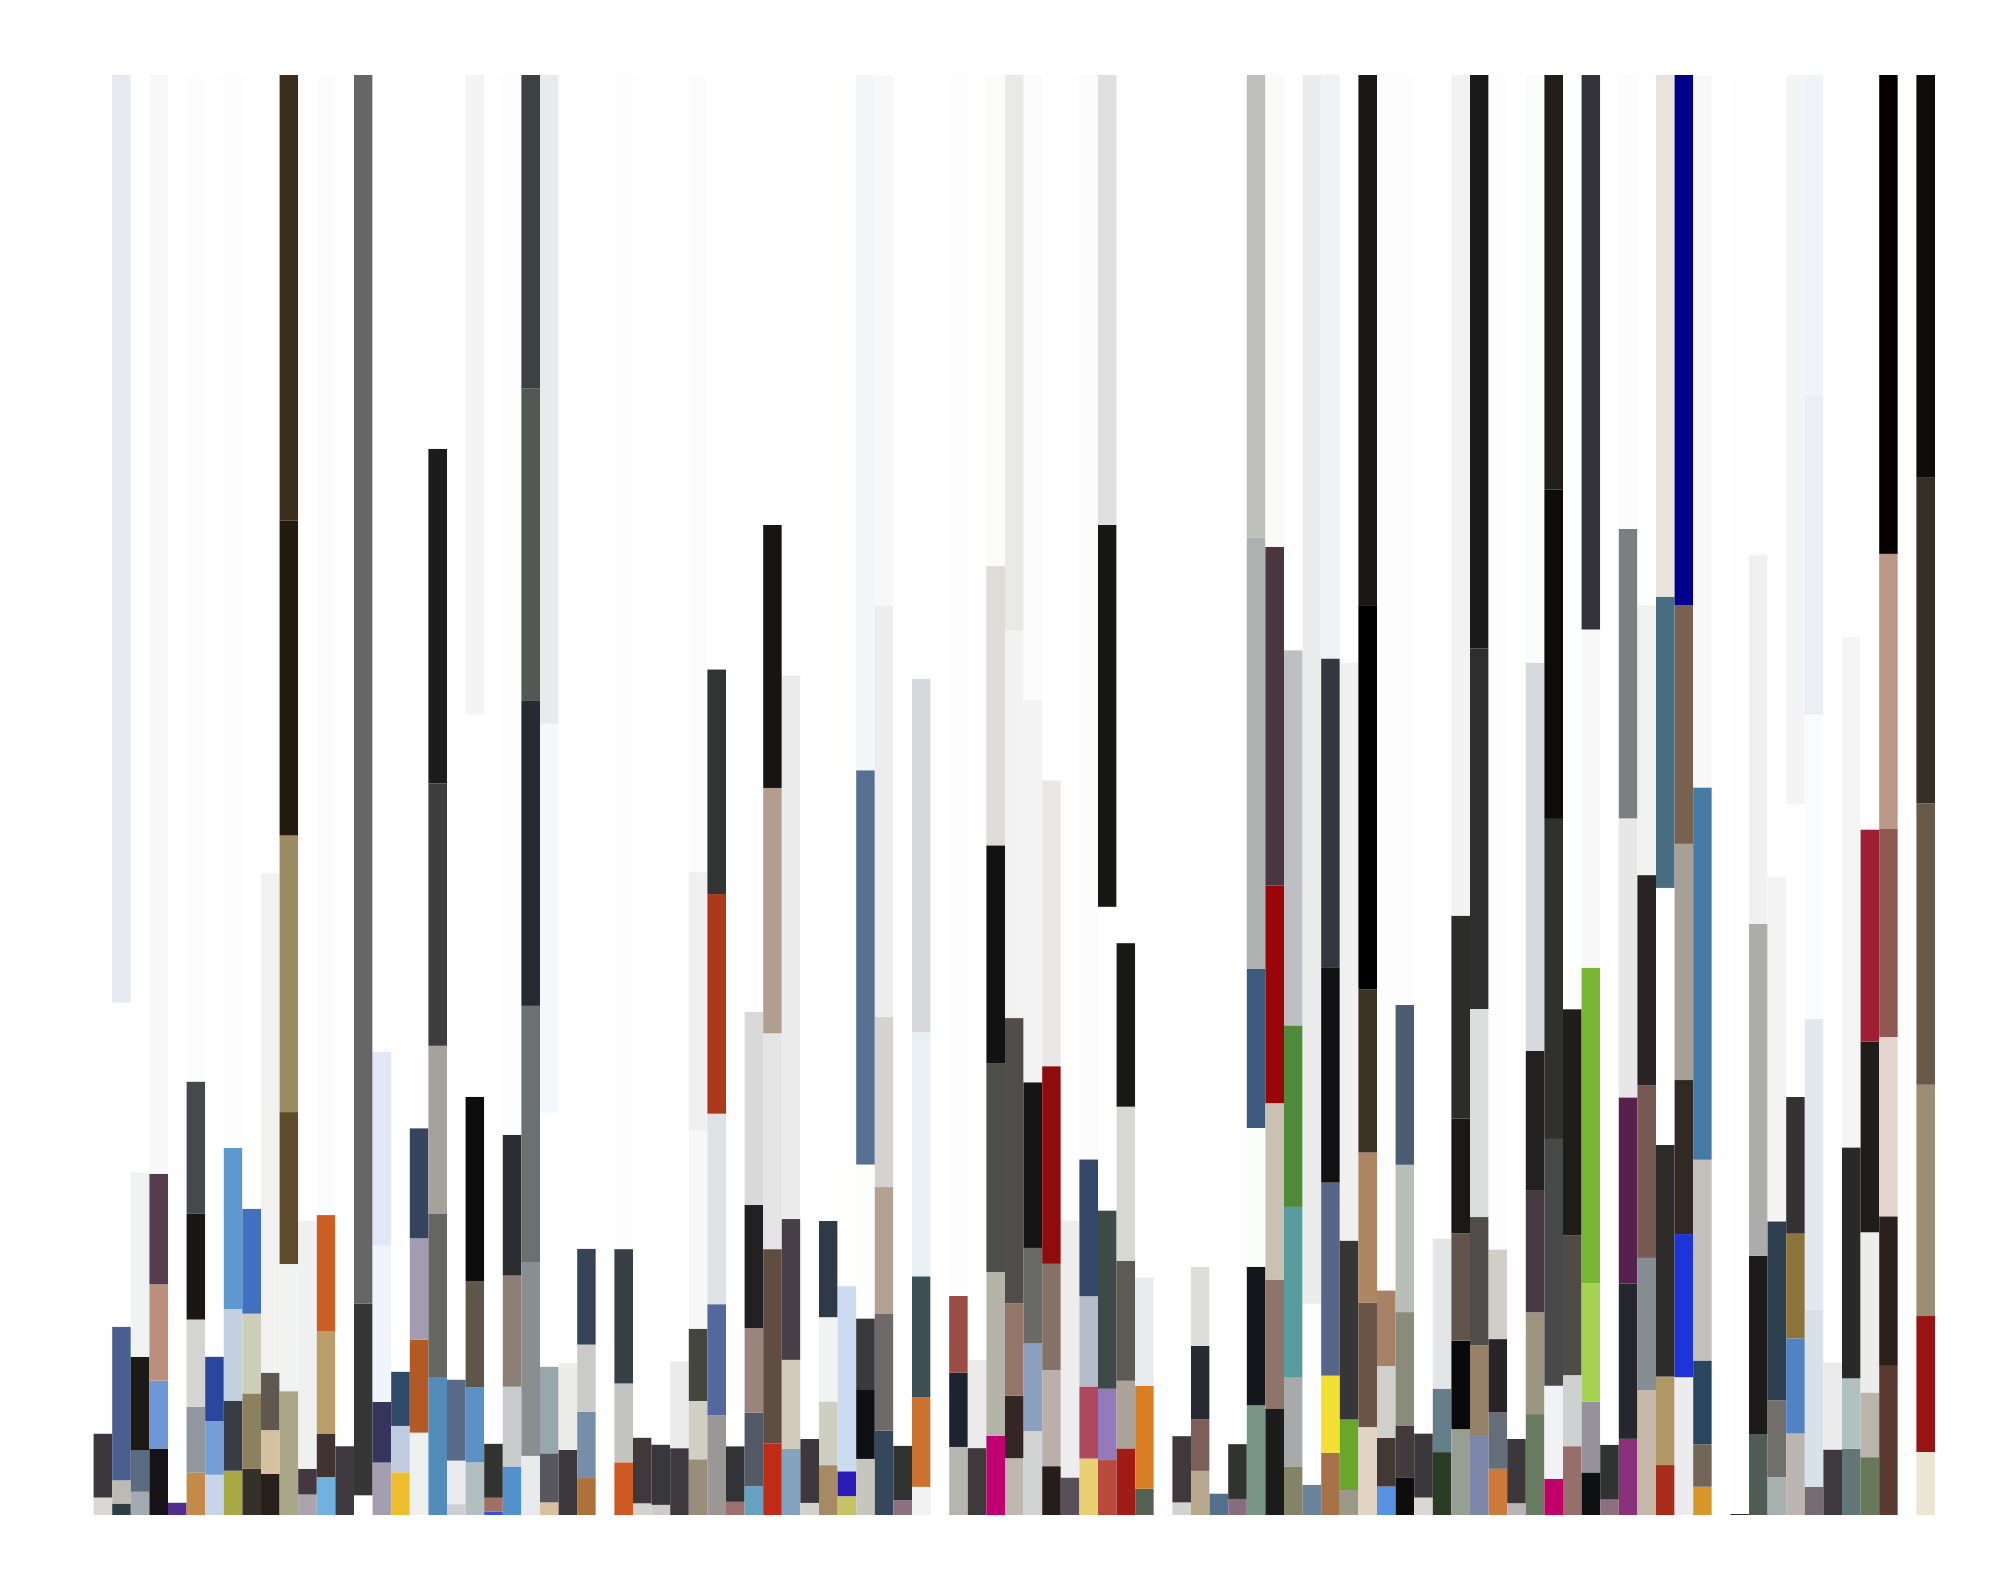
Andy Bardagjy, Constituent colors of top 100 websites on the internet. August 4, 2013.
Allison and I had been thinking about decomposing scenes, art, and geometries into representative colors, textures, and features. Then, during an inspiring walk around the MOMA, I spotted a woodblock print (below) by Sherrie Levine. In her prints Meltdown, she decomposes paintings by Duchamp, Kirchner, Mondrian, and Monet into their constituent colors. Can you guess which color-set corresponds to which artist?
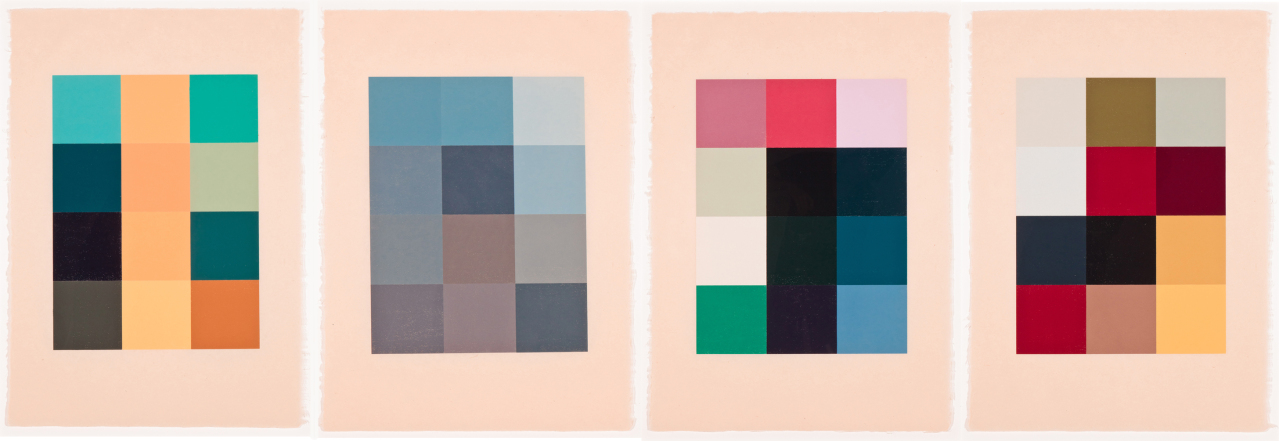
Sherrie Levine, Meltdown. 1989.
I’m interested in similar studies. I want to leverage the internet to understand composition, colors, and themes of designs and art which influence our society. This project builds on those ideas by exploring the colors which make up the most visited sites on the internet.
How it Works
These days I’ve been writing a lot of Python (2.7) and figured this would be a nice project to hack on during PyData. In the script webcolors.py, I first grab a list of the top 1 million most visited websites generously compiled by Alexa. Then, for each of those sites, I compute their constituent colors and save them to a big JSON document (I usually use a database for this, but wanted to play with JSON). In a separate python script, I use matplotlib to plot the colors.
Initially I expected this to be an exercise in text parsing. I would pull down the source files which are rendered into the webpage, search them for color tags and generate a visualization. I quickly realized that approach was futile. Most of the top websites are heavily reliant on Flash, javascript or other technologies. I realized that in order for me to deduce the colors of a modern website, I’d have to render it – effectively building an entire web-browser. Not to mention, many websites have large images, which are impossible to parse simply using text based analysis of a website.
To find the colors of a webpage, I would have to render the page using a browser. I chose Chrome powered through the Selenium webdriver. Using selenium, I grab a base64 encoded screenshot of the website. I convert it into a Python Imaging Library (PIL) image. The PIL image is converted to RGB and resized to QVGA (320×240) to speed the color computations.
To compute the representative colors of each webpage, I use k-means clustering with (sort-of) expectation maximization to pick the optimal number of clusters. I usually cap the maximum number of clusters at six, though sometimes I allow up to ten clusters. I rely heavily on SciPy for most of the heavy lifting here. The images are posterized with their representative colors, and the number of each pixel is computed. From there, the colors, plus some other metadata (load times, rank etc) are written to a JSON file for future visualization.
In the script, webplot.py, I parse the saved JSON document and plot the results via Matplotlib. In the topmost image, the top 100 websites are plotted from left to right. The top three sites in that figure are Google, Facebook, and Youtube. It’s easy to notice a bug when examining the colors for Google (note, this is normal google.com not a doodle). Notice how the three colors are light gray, dark gray, and white – not the typical red, green, blue, yellow color scheme. Why? Well, when the image screenshot is resized to 320 x 240 pixels for processing, the colors are dithered. The number of pixels in the new image that lie *between* red, green, blue, yellow and white – the dominant background color – is much larger than the number of pixels that are colored. Because of dithering, those between pixels are closer to shades of gray, than colors, and thus the k-means clustering (with EM) finds shades of gray and white to be the “color of Google”. I’m not sure if this is a bug.. what do you think?
Grab the Source
As always, you can check out my source
git clone git://git.bardagjy.com/webcolors |
I’m fairly pleased with the code. There are a few things I’d like to make a bit cleaner. First of all, I’d like to add command line input parameters rather than have them at the top of the file.
When I first designed it, the urlimg method simply took in a url and optionally a a screenshot resolution and returned a base64 encoded screenshot. For performance reasons, I now open one browser in the main method, then pass the browser object to the method that screenshots each page. This makes the urlimg method a bit less modular. In the future, I’ll make the browser parameter optional, if a browser object is not passed in, the method will create a browser object, take a screenshot, and close the browser. However, if a browser object is passed in, the function will use it to produce a screenshot.
Another issue is how I store the colors and other metadata of each webpage. Though I would normally put all of this in a database, I decided to store this stuff as a big JSON object because I’ve been messing with JSON at work. JSON appears to be a fine choice for this type of data, but instead of incrementally writing to the file (like I should), I store everything in a big dictionary which I dump to a JSON file when everything has finished. The good news is 1000 sites is only around 250KB, so 1M sites should be around 250MB, it’s bad, but I can keep that in memory.
The last fudge is how I deal with slow to load websites. During testing, I found that some websites took longer than 30,000 us to load. This causes the chromium driver to timeout, throwing an exception. My hypothesis was that the slow load time was a result of temporary network or computer (I often ran it in a small virtual machine) issues. To resolve this, I simply caught the exception in a try / except statement, and tried to load the page again. If the page threw a timeout exception five times, the url was skipped. During testing, when evaluating the top 1000 urls this fix entirely resolved the problem, no urls were skipped.
Finally, because the code is dependent on so many external packages, in the future, maybe I’ll package it up so it can be installed via pip.
Popups and Porn
I learned a lot about the internet while I was running this experiment, things that I hope to turn into other visualizations and studies. Five or six of the sites in the top 100 are porn – this makes running the scraper in the background at work a bit awkward. Probably just shy of half of the top 100 sites are in English (I expected fewer). A shocking number of sites in the top 100 autoplay music or videos when the site is loaded. I thought that was a thing of the past! Another surprising thing is the number of spammy popups generated by the top 100 that are able to defeat Chromium’s better-popup-blocking. To make running this a bit less obtrusive, I run it inside an Ubuntu virtual machine!
Top 1000
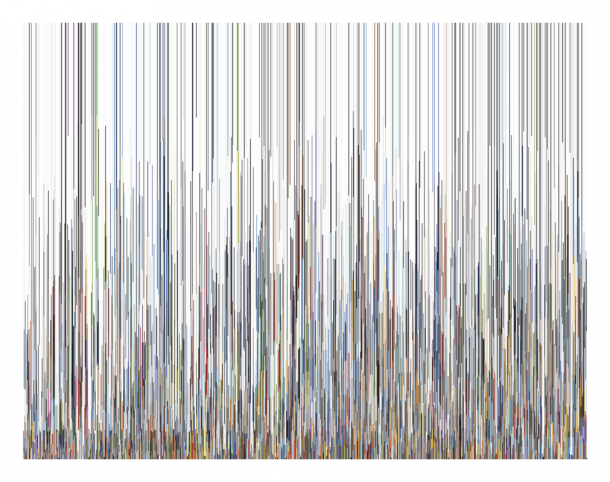
Andy Bardagjy, Constituent colors of top 1000 websites on the internet. August 6, 2013. (links to pdf).
Finally, a visualization of the colors of the top 1000 websites. Very weird how there seems to be a “noise floor”, a level where many sites seem to have the same number of pixels – though not the same colors. To me, this indicates either a bug in my algorithms, or maybe a common design aesthetic? Does the distribution follow the Golden Ratio or the Power Law?
[…] you liked this, you might also be interested in: Colors of the Internet (which I found as I was waiting for pictures to upload to this post – beautiful […]